Development of a system to study the effects of local cooling on skin blood flow response to interface pressure
Yi-Ting Tzen, BS, Yih-Kuen Jan, Ph.D., PT, David M. Brienza, Ph.D.
University of Pittsburgh, Pittsburgh, PA
ABSTRACT
Pressure ulcers are a significant issue for people with limited mobility. Among the known extrinsic causative factors contributing to pressure ulcer development, the influence of skin temperature is one of the least explored. Previous animal model research has demonstrated that focal cooling reduces the severity of pressure ulcers as compared with non-cooling (1). However, the mechanism by which this occurs is not understood. The goal of this study was to develop a computer-based system to simultaneously control skin temperature, interface pressure and measure skin blood flow. A Peltier transducer and proportional-integral-derivative (PID) controller were used for temperature control. Pressure is controlled using a custom designed indenter assembly. The system has been tested on two human subjects. The results indicate it is reliable. This system is suitable for non-invasive measurement providing researchers easy access to tissue physiological responses under controlled temperature and prolonged pressure on human subjects.
KEYWORDS
pressure ulcers; seating; skin cooling, laser Doppler flowmeter (LDF); Peltier module
BACKGROUND
Pressure ulcers have long been an important healthcare problem in people with impaired mobility. Among risk factors contributing to pressure ulcer development, the effects of temperature are among the least explored. Kokate et al. (1) first investigated the tissue response on porcine under both local cooling and prolonged pressure. They applied different temperatures on skin accompanied with prolonged pressure and discovered that sites with lower skin temperature had less tissue damage. This indicated that local cooling had a protective effect and enhanced tissue integrity. Focal cooling as a tissue preservation method has also been adopted in clinical areas such as plastic surgery (2) and organ transplantation (3). The underlying mechanism of the preservative effect remains unclear; however reduced tissue metabolism rates associated with lower temperatures might help explain this phenomenon. Prior work has revealed that tissue metabolic rate increases 6~13% with every 1°C elevation (4).
STATEMENT OF THE PROBLEM
Most studies on local cooling effect on pressure ulcer prevention have been performed on animal models, however, human study is needed to understand the underlying mechanisms. A non-invasive integrated test system is required to perform the study on human subjects. This work aimed to develop such a system.
METHODS
Subject and Research Design
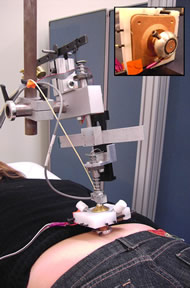 Figure 1: Test Setup (Click for larger view)
 Two young healthy male subjects (age 26 and 35) were recruited to evaluate the test system. They had no history of cardiopulmonary disease, hypertension or diabetes. Caffeinated food and drinks were prohibited 12 hours prior to the test. The subjects lay prone on a mat table and the test was performed on the skin at the sacrum (figure 1).
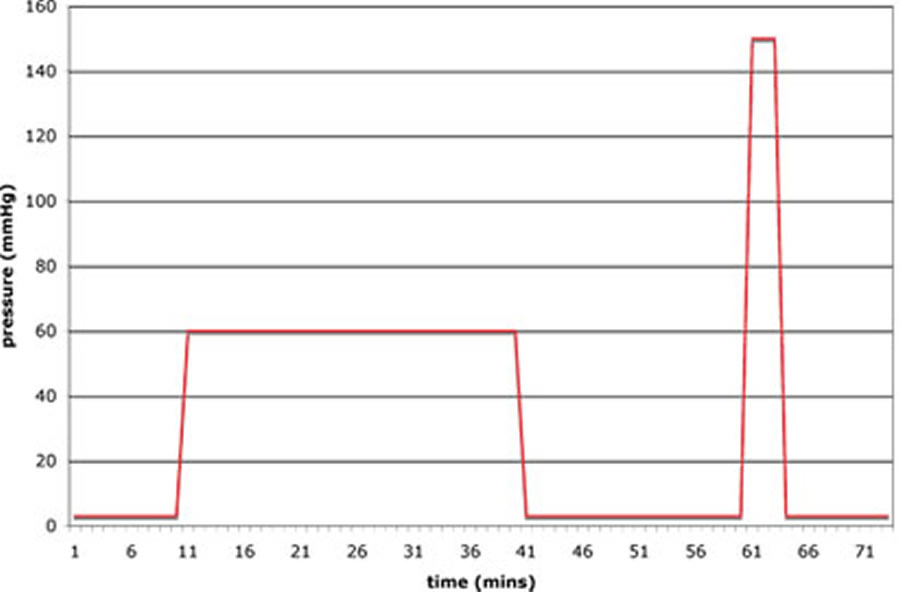 Figure 2: Test Procedure (Click for larger view)
 This study used a repeated measures design; each subject was subjected to both procedures: cooling (25°C), and non-cooling (value varied individually). The order of the test procedures was randomized. Both procedures used the same in pressure application pattern. The only difference was active cooling or not during the 60mmHg pressure application phase. The test procedure took 73 minutes and contained five phases with different pressures (figure 2): 10 minutes at 3mmHg, 30 minutes at 60mmHg (cooling or non-cooling), 20 minutes at 3mmHg, 3 minutes at 150mmHg, and 10 minutes at 3mmHg. 3mmHg provides light contact on skin, 60mmHg simulates sitting pressure on cushions, and 150mmHg is intended to completely occlude blood flow. Data recorded included applied pressure, skin temperature, and blood flow. Heart rate and blood pressure were measured before and after the study to ensure safety and comfort of the subjects.
Instrumentation
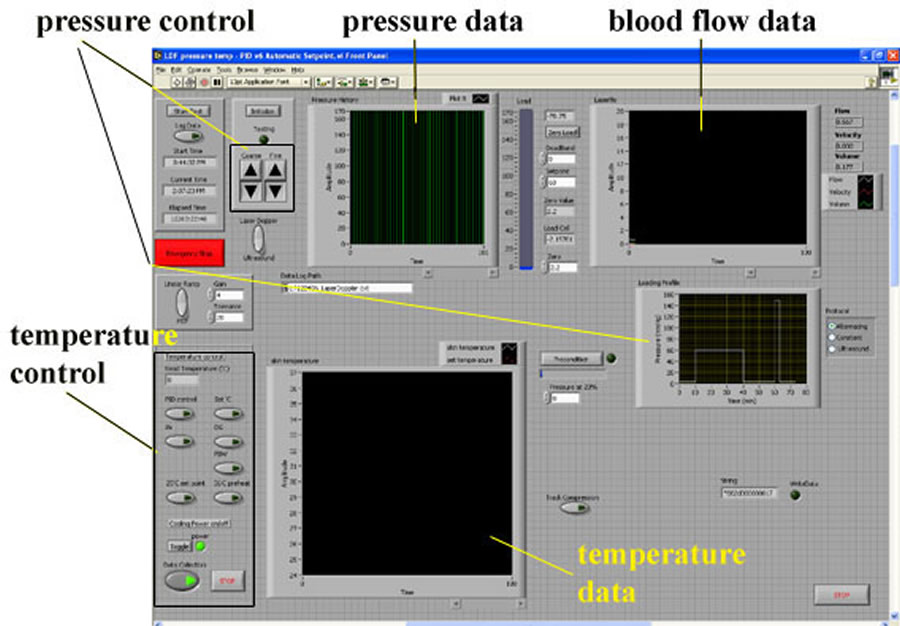 Figure 3: Computer Control Interface (Click for larger view)
 The instrumentation used in this study contains three major components: pressure applicator, temperature control, and skin blood flow detection (figure 3). A customized indenter was used for pressure application. Tip of the indenter contains the Peltier effect thermoelectric transducer for controlling temperature and was in direct contact with skin over the sacrum (figure 4.).
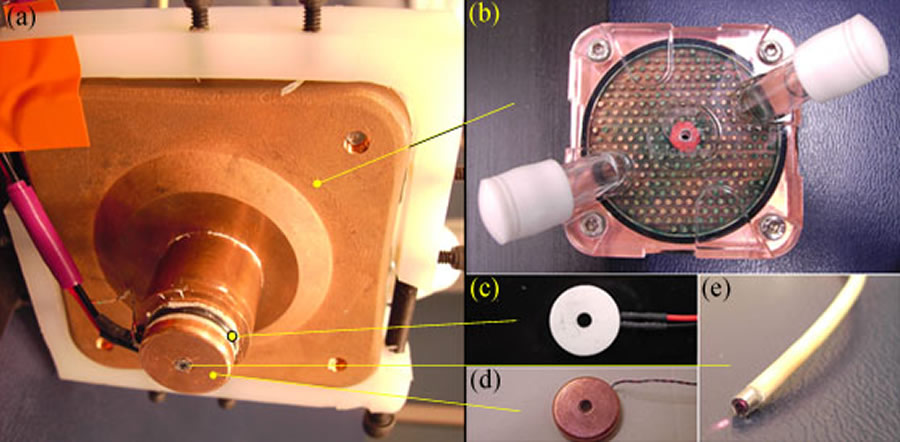 Figure 4: Instrument Components (Click for larger view)
 PID controllers are embedded for both temperature and pressure control. The temperature control system contains three parts: a thermoelectric module (model CH-19-1.0-1.3, TE technology Inc., USA), a thermistor and a heat sink. The thermoelectric module (Peltier module) is a solid-state component, which transfers heat from one side to the other. A thermistor (model MP-2444, TE technology Inc., USA) was used embedded in a custom copper plate (same size as the Peltier module). A copper radiator (Gigabyte Inc., Taiwan) with circulating coolant served as the heat sink. Heat conductive glue was used to adhere the three components, and the flat surface of the customized thermistor plate to provide a comfortable contact with the target skin. A laser Doppler flowmeter (LDF) (model P-435, Vasamedics, USA) was placed in the middle of the indenter head to measure blood flow. All data sampled at a rate of 20Hz and stored for later analysis.
Data analysis
Basic descriptive analysis of raw data was made for the 60 and 150mmHg of pressure phases for both subjects and procedures. The data points were averaged every 30 seconds for visualization purposes. The figures were then compared within and between subjects.
RESULTS
Interface Pressure
|
60mmHg | 150 mmHg | ||||||
|---|---|---|---|---|---|---|---|---|
|
Subject one | Subject two | Subject one | Subject two | ||||
| cooling | non-cooling | cooling | non-cooling | cooling | non-cooling | cooling | non-cooling | |
Mean |
56.06 |
55.04 |
49.32 |
52.29 |
145.97 |
143.71 |
134.69 |
143.27 |
Median |
56.62 |
55.40 |
52.74 |
53.40 |
146.72 |
145.14 |
136.31 |
143.33 |
Minimum |
14.38 |
26.42 |
-8.84 |
8.91 |
125.53 |
114.31 |
87.61 |
115.27 |
Maximum |
105.92 |
87.60 |
124.62 |
104.29 |
166.50 |
179.56 |
176.41 |
165.73 |
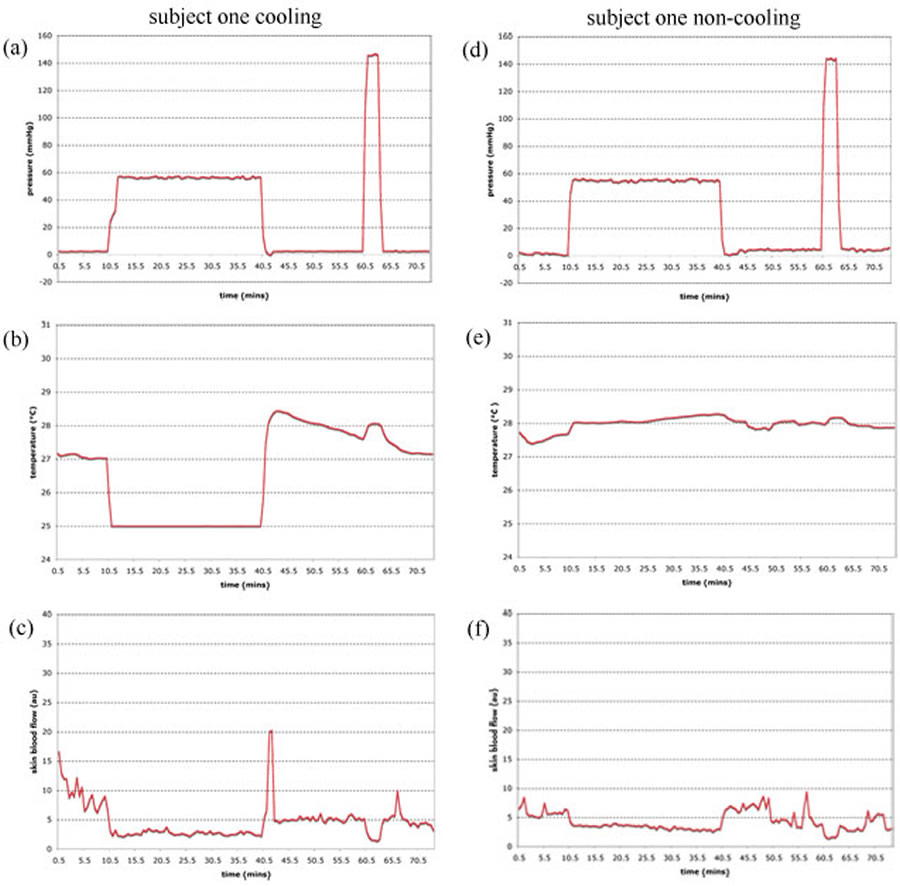 Figure 5: Subject One Data (Click for larger view)
 In figure 5(a), (d), 6(a), and (d), steady control of pressure was noted throughout the test except for a persistent oscillation in figure 6(a) (subject two at cooling). All four plots demonstrated pressure application slightly lower than the set point (at both 60 and 150mmHg). Descriptive analysis showed a wide range of pressure fluctuation during these periods.
Skin Temperature
In figure 5(b), and 6(b), skin temperature dropped to the 25°C set point within one minute and was maintained within .02°C over 30 minutes. An abrupt increase in temperature was observed immediately after deactivating the active cooling. This response decreased slowly until baseline values were reestablished. In figure 5(e), and 6(e), a slight increase in skin temperature was recognized at both 60 and 150mmHg of pressure (both <1°C).
Skin Blood Flow
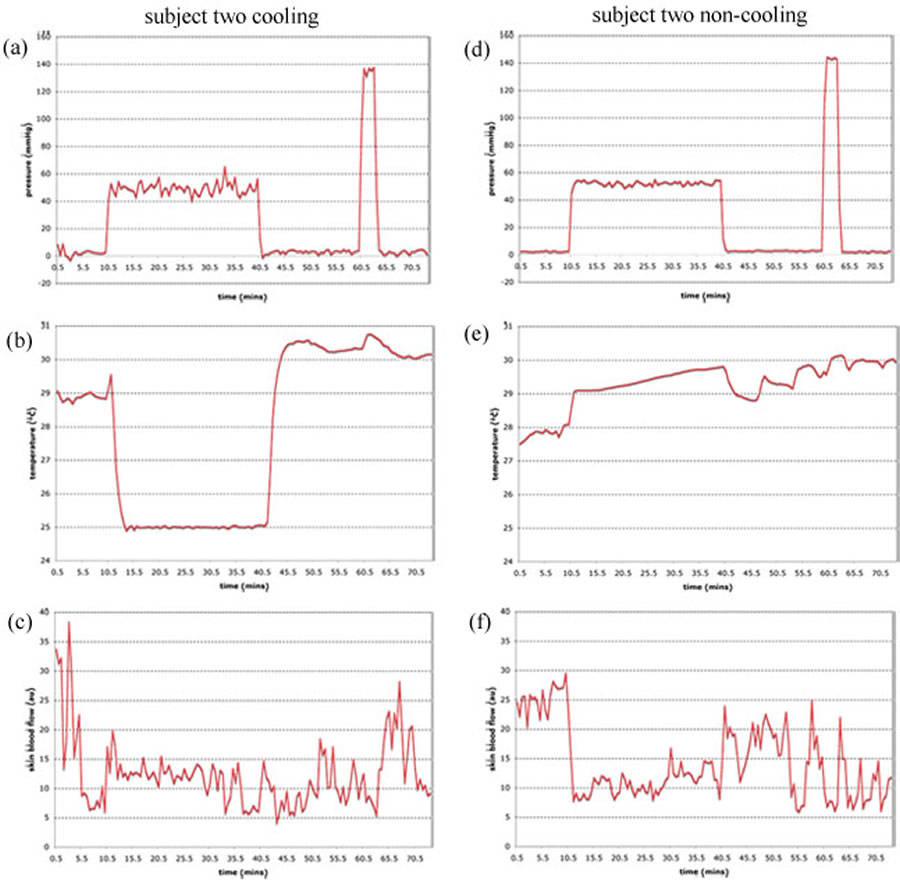 Figure 6: Subject Two Data (Click for larger view)
 Figure 5 (c), (f), 6 (c) and (f) are skin blood flow data. Comparing skin blood flow and temperature, the subject with higher skin temperature generally has higher skin blood flow. Comparing the two subjects, blood flow in subject one is more stable than in subject two. Constant fluctuation of blood flow in subject two coincides with the observed oscillation of pressure (figure 6 (a) and (c)). A sudden increase in blood flow immediately following 60mmHg of pressure removal was observed in all four test conditions, especially in subject one. This phenomenon was observed following the release of 150mmHg of pressure as well.
DISCUSSION
Interface Pressure
The apparent interface pressure oscillation in subject two at cooling was due to constant and rapid adjustment of the indenter. A ball-and-socket joint is used at the base of indenter head to accommodate various body contours; however, the joint introduced backlash into the system and oscillations in the output (in subject two with active cooling). We restricted the joint movement and found this phenomenon was eliminated in the subsequent test procedure (subject two with non-cooling). The wide range of pressure loading at both 60 and 150mmHg was due to the subject movement, e.g. respiration. The movement was especially prominent in subject two at cooling (first procedure). The range decreased as soon as the subject held his breath. We adopted the concept of using deadweight on the indenter to provide exactly 150mmHg of pressure on skin. This adjustment eliminated respiration artifact in the second procedure (decreased fluctuation in subject two non-cooling).
Skin Temperature
The sudden elevation in skin temperature accompanied with increased blood flow immediately after cooling removal is the skin re-warming response consistent with other studies (5). The mild increase in skin temperature at both 60 and 150mmHg of pressure was due to close contact of the indenter and skin; this agreed with previous seat cushion studies in which close contact of skin with support surface caused skin temperature elevation (6). The system provided us with a realistic simulation of skin contact with a support surface.
Skin Blood Flow
Several features of the blood flow are evident in the data. The constant oscillation throughout the procedure in both subjects was due to the normal rhythmic physiological response embedded in vasomotion (7). The response can be characterized in frequency domain. The sudden increase in blood flow immediately after 150mmHg pressure removal is the reactive hyperemic response; it is especially obvious in skin after ischemia removal to meet oxygen requirements (8). This response is of particular interest since may be help gain understanding of tissue metabolism under prolonged pressure and local cooling.
CONCLUSION
We have developed an integrated system that could be used to study the effects of skin cooling on enhancing tissue viability. Our system has been tested in two human subjects and demonstrated reliable control of skin temperature and interface pressure. Our pilot results indicated that skin temperature increased over time when closely contacted without temperature control, and reactive hyperemia for further physiological investigation was induced under prolonged pressure accompanied with different temperatures. We will apply the same protocol on additional young healthy subjects, and then on people at risk for pressure ulcers. Findings from our study have the potential to improve current cushion technology for preventing pressure ulcers.
REFERNCES
- Kokate, J.Y., et al., Temperature-modulated pressure ulcers: a porcine model. Arch Phys Med Rehabil, 1995. 76: p. 666-73.
- Sterne, G.D., O.G. Titley, and J.L. Christie, A qualitative histological assessment of various storage conditions on short term preservation of humand split skin grafts. Br J Plast Surg, 2000. 53(4): p. 331-6.
- Riess, M.L., et al., Reduced reactive O2 species formation and preserved mitochondrial NADH and [Ca2+] levels during short-term 17°C ischemia in intact hearts. Cardiovascular Research, 2004. 61(3).
- Ruch, R.C. and H.D. Patton, Energy metabolism. 19th ed. Physiology and biophysics, ed. R.C. Ruch and H.D. Patton. 1965, Philadelphia: Saunders Pr. 1064.
- Nagashima, Y., et al., Evaluation of the use of an integration-type laser-Doppler flowmeter with a temperature-loading instrument for measuring skin blood flow in elderly subjects during cooling load: comparison with younger subjects. Int J Biometeorol, 2003. 47(139-47).
- Cochran, G.V.B., Measurement of pressure and other environmental factors at the patient-cushion interface. Chronic ulcers of the skin, ed. B.Y. Lee. 1985, New York: McGraw-Hill. 23-37.
- Geyer, M.J., et al., Using wavelet analysis to characterize the thermoregulatory mechanisms of sacral skin blood flow. Jouranl of Rehabilitation Research and Development, 2004. 41(6A): p. 797-806.
- Levick, J.R., Control of blood vessles I: intrinsic control. 4th ed. An introduction to cardiobascular physiology, ed. J.R. Levick. 2003, New York: Oxford University Pr. 217-231.
ACKNOWLEGEMENTS
We would like to thank Erik Porach, BC Deemer, and Jon Akins on the technical support of the instrument development.
Author Contact Information
Yi-Ting Tzen, BS, University of Pittsburgh, 2310 Jane Street Suite 1300, Pittsburgh, PA 15203, Office Phone (412) 586-6916, EMAIL: yit10@pitt.edu